 Size Run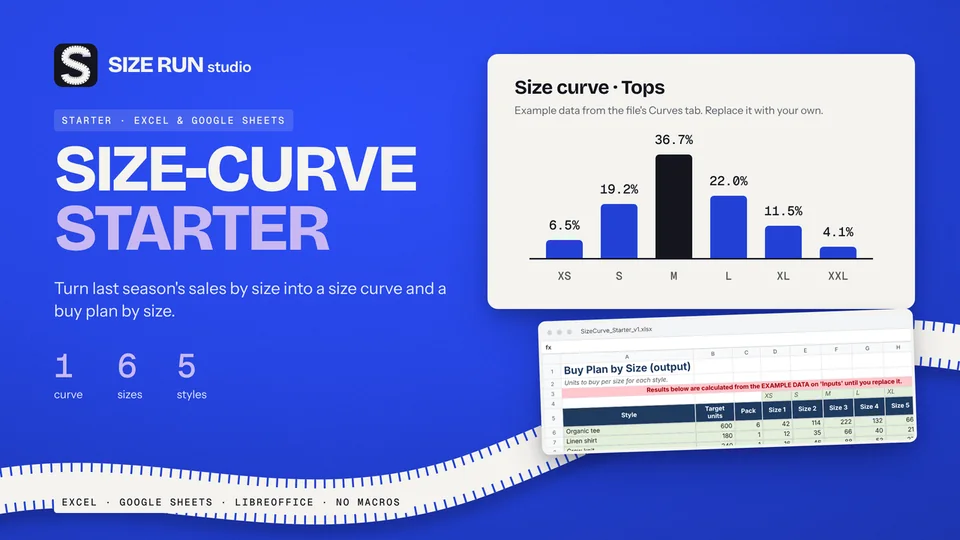
Free size curve template for apparel buyers
Turn last season's units by size into a buy plan. Free.
How to track short-term rental income and expenses in a spreadsheet: bookings, host fee, payout, occupancy and profit per property, with a worked example.
If you rent out one to five properties on a platform like Airbnb, the number that matters is what each property keeps after fees and costs. This page lists what an income and expense tracker should record, shows the formulas, and walks through one booking with invented numbers.
One booking per row keeps the log simple and lets you filter by property or month later.
Costs belong in a separate log with a date, the property (or "shared" for costs that serve all of them), a category and an amount. Keep the category list short and editable, for example cleaning, supplies, utilities, repairs, software and insurance. Ten categories are plenty. Too many categories make the monthly view harder to read.
Every number in the dashboard comes from a few steps.
These figures are made up. The fee rate below is an editable example of 15.5 percent. It does not reflect any platform's current fees. Check your own payout breakdown and enter the rate that applies to you.
One property, one booking in a 31-night month. The stay is 4 nights and the guest paid 520.00 in total. Cleaning cost 60.00 and supplies cost 15.00.
Change the rate to see how much one percentage point moves the payout.
A stay from the 29th of one month to the 3rd of the next belongs partly to each month. If the whole stay lands in the month of check-in, that month shows too high an occupancy and the next one too low. A good tracker counts nights by the real overlap with each month, so the monthly view stays honest.
The formulas above fit into a plain spreadsheet, and building your own is a fair way to start. A ready template saves the setup time.
The Short-Term Rental Income & Expense Tracker is an Excel workbook with 11 tabs: Instructions, Settings, Bookings, Expenses, Monthly, five property tabs and a Dashboard. The bookings tab holds 400 rows and the expenses tab 500 rows with 10 editable categories. The fee table is editable and starts with a single host fee of 15.5 percent, a legacy split fee of 3 percent, direct bookings at 0 percent and three free rows for other platforms, as a snapshot of October 2026. You can override the fee on any booking. Nights are split across months by real overlap. The dashboard shows year totals, results by property, expenses by category and a monthly chart. Example data is included and marked, so you can delete it before real use. It has no macros and opens in Excel and LibreOffice.
Version one does not model taxes of any kind, currency conversion, refunds and cancellations (enter the net amount), depreciation, mortgage splits or owner payouts. It is a record-keeping aid, not financial, tax, accounting or legal advice. Airbnb and Microsoft Excel are trademarks of their owners, and Size Run Studio has no affiliation with either.
The Short-Term Rental Income & Expense Tracker is a paid digital download. You get the Excel workbook with clearly marked example data and a one-page Quick Start PDF. Nothing is shipped.
See the Short-Term Rental Income & Expense Tracker
For each booking: property, check-in and check-out dates, nights, gross amount, platform fee and payout. For each cost: date, property or shared, category and amount. From these you get payout, profit, occupancy and average nightly rate per month and per property.
Divide the booked nights that fall inside the month by the nights available in that month. A stay that crosses a month end has to be split by the real overlap, otherwise one month looks too full and the next too empty.
Fee structures differ by account, country and date, and they change. Keep each rate in one editable cell, compare it with your own payout breakdown and override the fee on any booking where the real amount differs.
No. A tracker is a record-keeping aid. Ask a qualified adviser how to treat income, expenses, depreciation and taxes in your country.
Turn last season's units by size into a buy plan. Free.
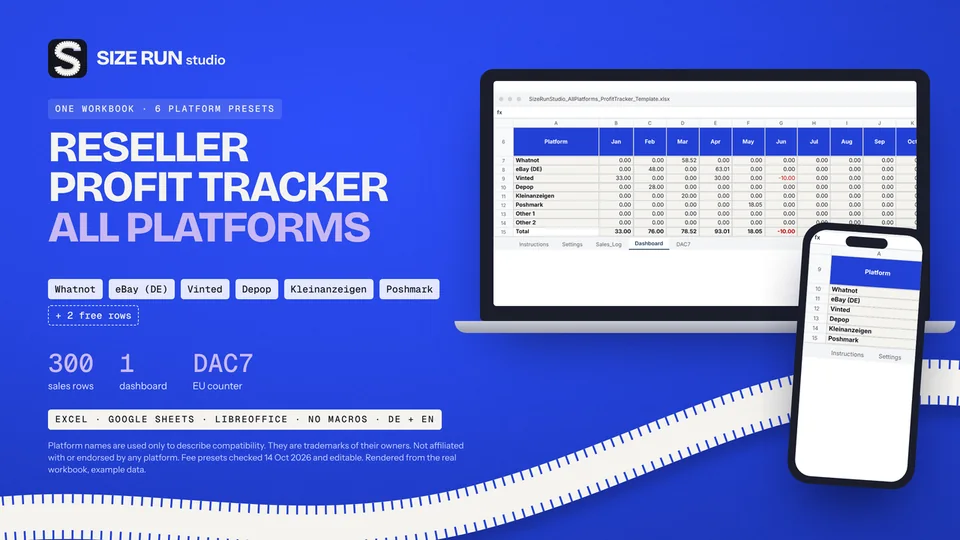
Fees, net profit, margin and ROI per platform and month.
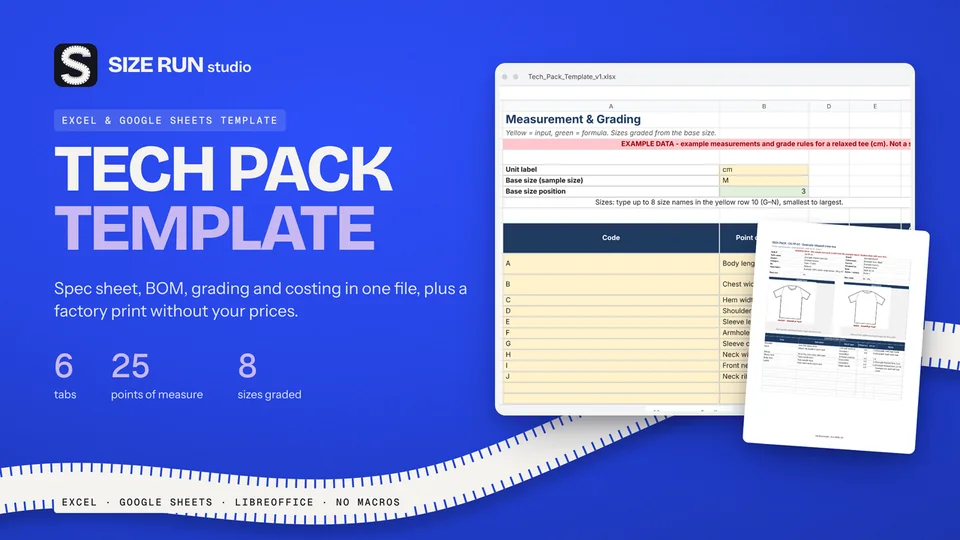
Spec sheet, BOM, grading and costing in one file.
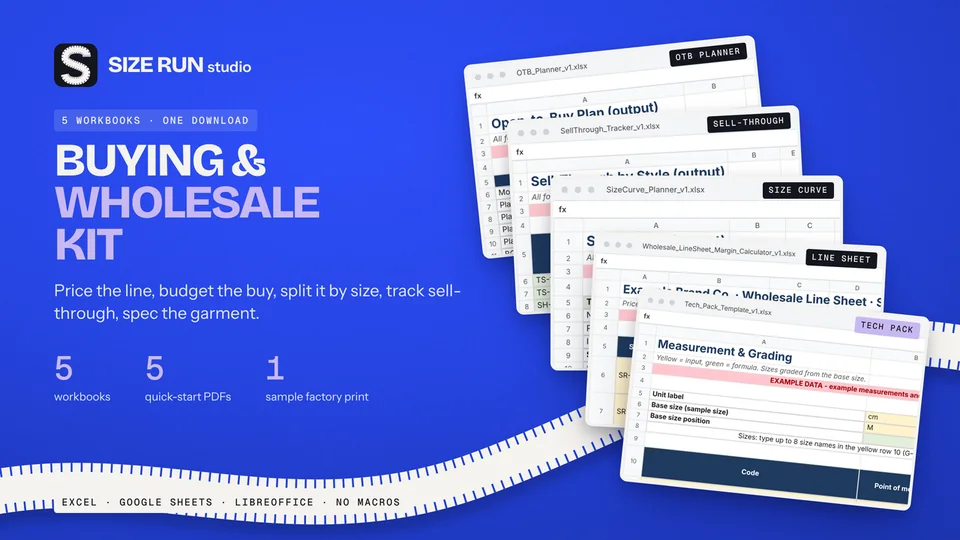
A worked example, step by step, from net units to units per size.
What you keep per resale after fees and shipping.
The open-to-buy formula with a worked example, at retail and at cost.
Sell-through rate and weeks of cover, with a worked example.
Why a 50% markup is not a 50% margin, with a worked example.
What a production tracker needs, how to flag late samples and orders, with a worked example.
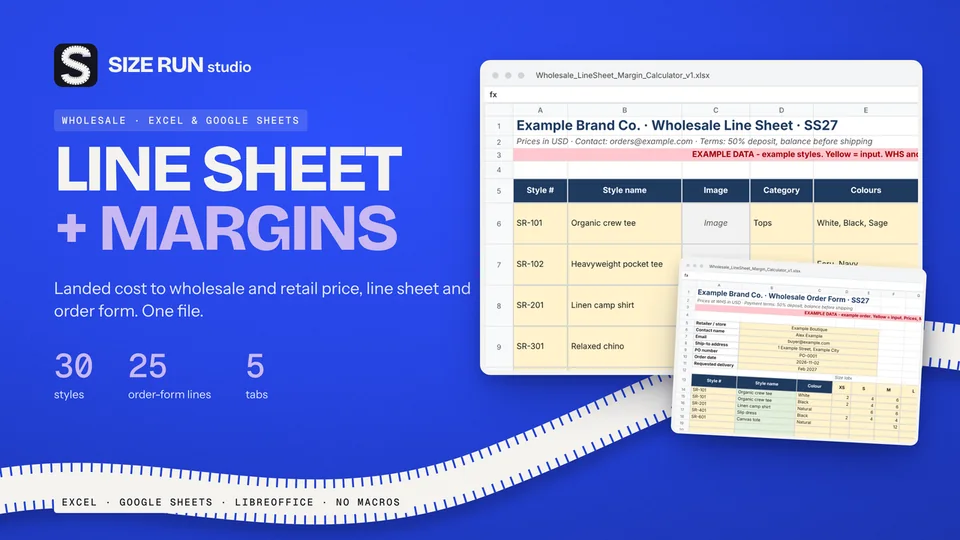
Which columns a wholesale price list needs and how to price from landed cost, with a worked example.
Fee, net profit, margin and ROI per sale, with a worked example and editable fee rates.
Line sheet, tech pack and production tracker: what each covers, plus a worked margin example.
Track Etsy fees, net profit and margin per sale, with a worked example and editable fee rates.
How to track invoices, overdue payments, income and profit per hour, with a worked example.
How to budget when every month pays differently: baseline, buffer and set-aside, with a worked example.
How to track wedding vendor deposits, balances and due dates in one spreadsheet, with a worked example.
Invoice tracker and irregular-income budget planner in one bundle, with worked examples.