 Size Run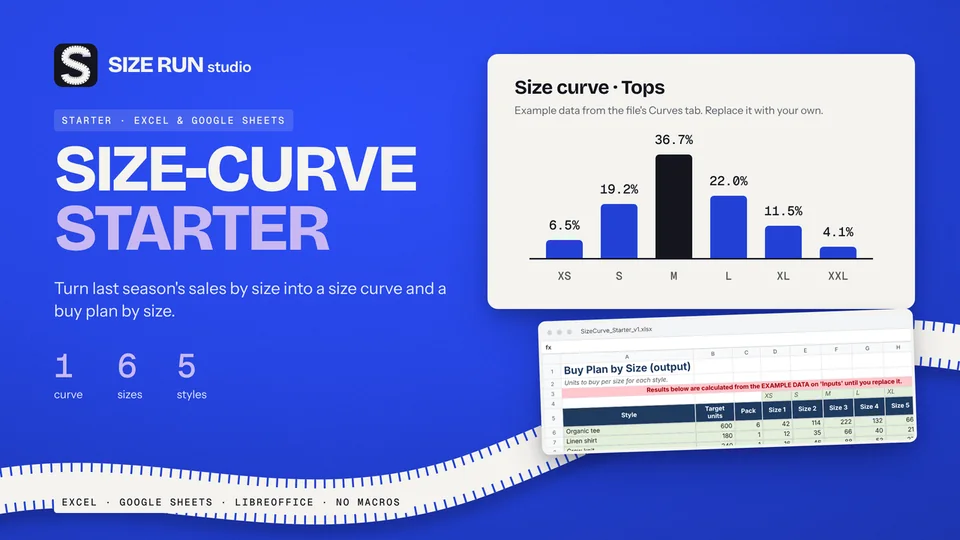
Free size curve template for apparel buyers
Turn last season's units by size into a buy plan. Free.
Open to buy explained: the formula, a worked example at retail and at cost, and how to use it to decide how much you can still buy this month.
Open to buy answers one question: how much can you still buy without ending the month with too much stock? This page explains the formula, walks through one worked example and shows where people usually go wrong.
Open to buy (OTB) is the budget that is still free for new purchases in a period. It is what remains after you plan sales, plan the stock you want at the end of the month, and subtract what you already hold and what is already on order.
At retail value, for one month:
OTB = planned sales + planned markdowns + planned end-of-month stock - beginning-of-month stock - stock on order
Each part has a plain meaning:
The first three parts are what you need to have available. The last two are what you already have. The gap is your open to buy.
These figures are made up to show the arithmetic. They are not market data. One month, all values at retail in EUR:
| Line | Value |
|---|---|
| Planned sales | 40,000 |
| Planned markdowns | 4,000 |
| Planned end-of-month stock | 60,000 |
| Beginning-of-month stock | 55,000 |
| Stock on order | 12,000 |
OTB at retail = 40,000 + 4,000 + 60,000 - 55,000 - 12,000 = 37,000.
Suppliers invoice at cost, so convert the result. In this example, cost is 50% of retail price, so OTB at cost = 37,000 x 0.50 = 18,500. That is the most you should commit to for delivery in this month. If your cost share differs by category, convert each category with its own share.
Compare your OTB with the previous month. If it jumped, find the line that moved. A large change usually traces back to one assumption, such as a new sales plan or a delivery that slipped into the next month. If you cannot explain the movement in one sentence, review the inputs before placing orders.
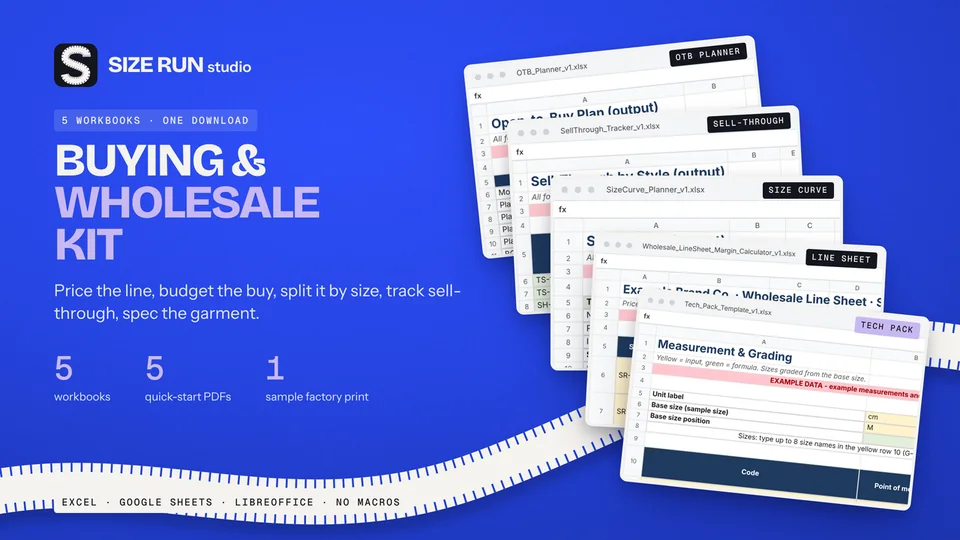
The Open-to-Buy Planner in the Buying & Wholesale Kit calculates open to buy per month at retail and at cost for a six-month season, flags overbought months and can split the budget across up to eight categories. It ships with labelled example data that you replace with your own figures. It is a planning aid and does not forecast demand for you.
The Kit is a paid product and also contains a Sell-Through Tracker, a Size-Curve Planner, a Wholesale Line Sheet with margin calculator and a Tech Pack template. You can build everything above in any spreadsheet for free, and the planner simply saves you the setup.
See the Buying & Wholesale Kit
Open to buy (OTB) is the part of a merchandise budget that is still free to spend on new stock for a period, after sales plans, stock on hand and orders already placed are taken into account.
Planners usually work at retail and then convert to cost, because sales and stock plans are set in retail value. You pay suppliers at cost, so the cost figure is the one that limits orders.
A negative result means you are overbought for that month. Options are to move deliveries, cancel or reduce open orders, or plan extra markdowns. It is a signal to act.
No. They are invented to show the arithmetic and are not market data.
Turn last season's units by size into a buy plan. Free.
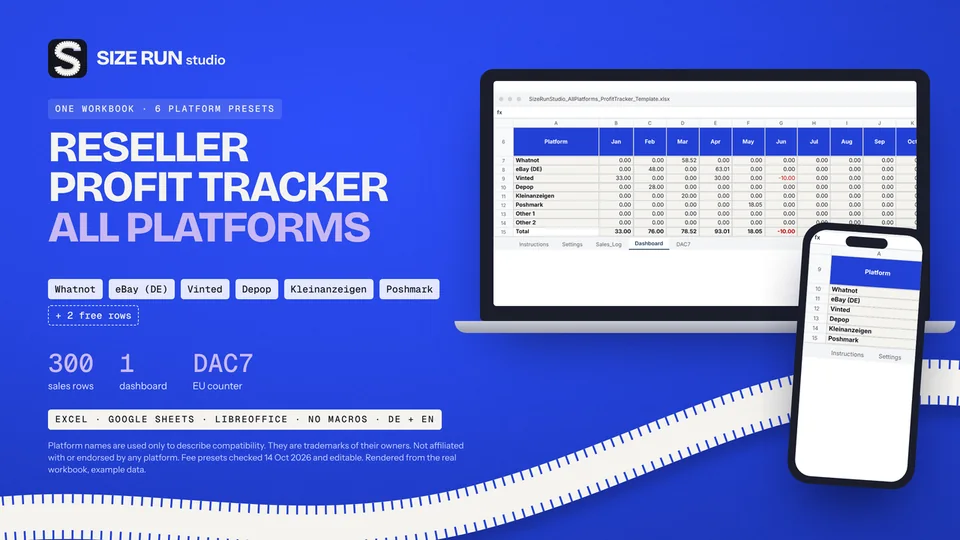
Fees, net profit, margin and ROI per platform and month.
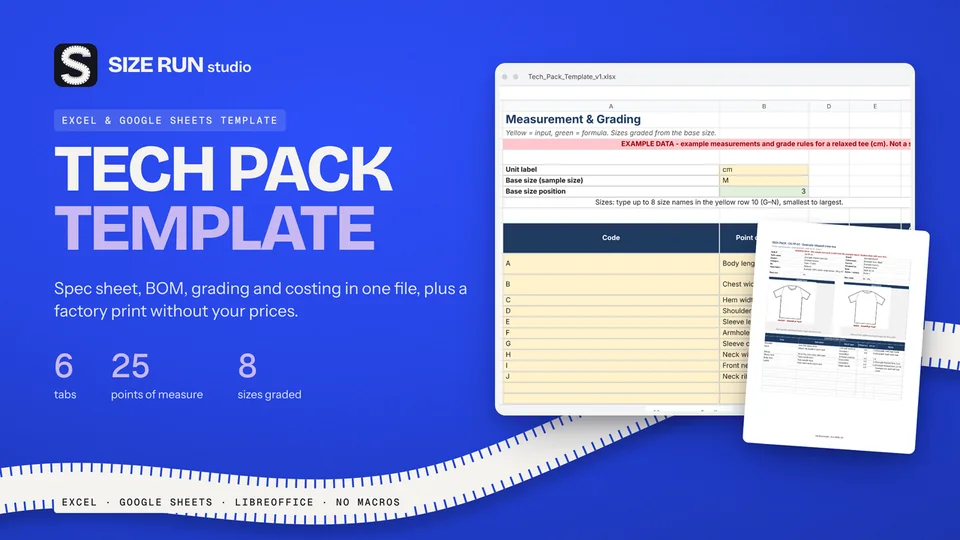
Spec sheet, BOM, grading and costing in one file.
A worked example, step by step, from net units to units per size.
What you keep per resale after fees and shipping.
Sell-through rate and weeks of cover, with a worked example.
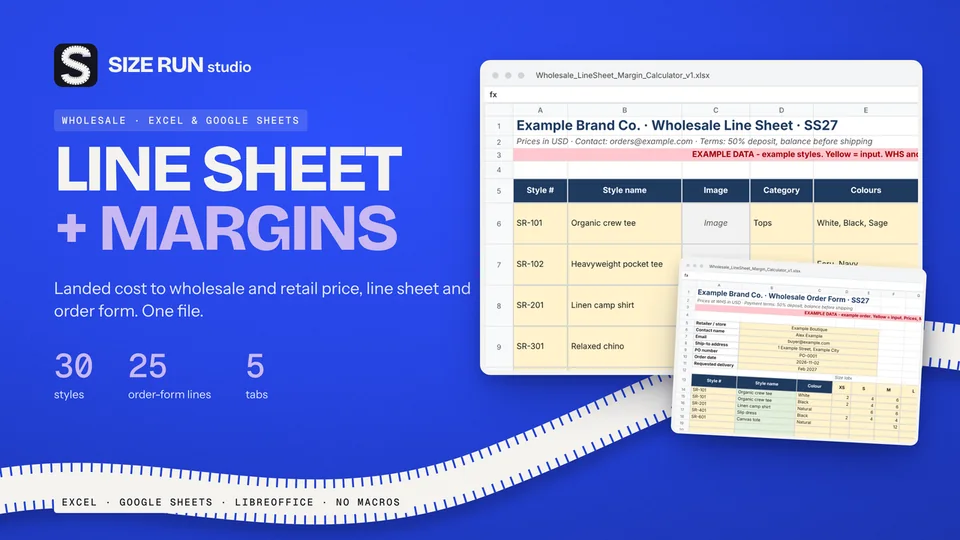
Why a 50% markup is not a 50% margin, with a worked example.
What a production tracker needs, how to flag late samples and orders, with a worked example.
Which columns a wholesale price list needs and how to price from landed cost, with a worked example.
Fee, net profit, margin and ROI per sale, with a worked example and editable fee rates.
Line sheet, tech pack and production tracker: what each covers, plus a worked margin example.
How to track bookings, host fee, payout, occupancy and profit per property, with a worked example.
Track Etsy fees, net profit and margin per sale, with a worked example and editable fee rates.
How to track invoices, overdue payments, income and profit per hour, with a worked example.
How to budget when every month pays differently: baseline, buffer and set-aside, with a worked example.
How to track wedding vendor deposits, balances and due dates in one spreadsheet, with a worked example.
Invoice tracker and irregular-income budget planner in one bundle, with worked examples.