 Size Run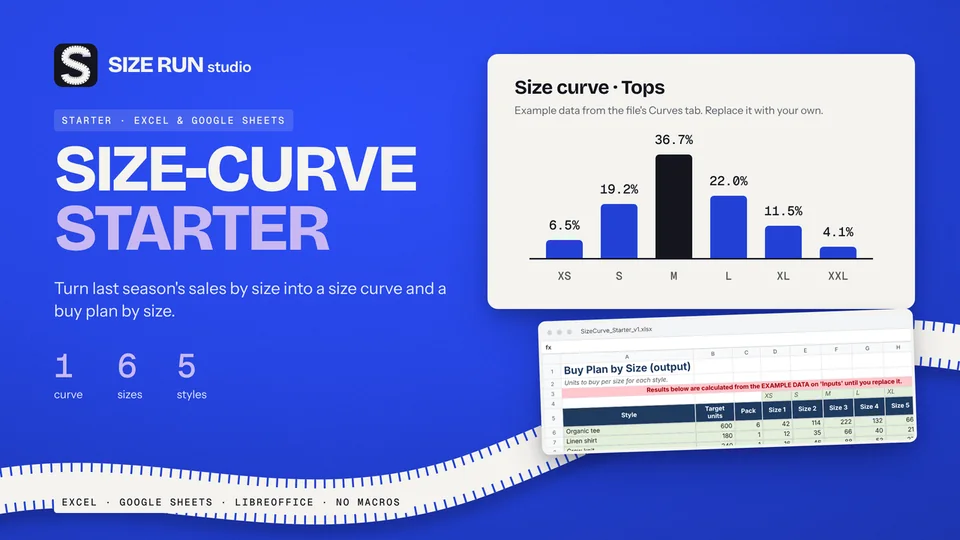
Free size curve template for apparel buyers
Turn last season's units by size into a buy plan. Free.
Spreadsheet that turns last season's units sold, returns and weeks in stock per size into a size curve and a units-per-size buy plan for up to 5 styles.
An even split across sizes feels fair and tends to fail on the rail: too much of the outer sizes, sell-outs in the middle. A size curve replaces that split with shares based on your own history. Here is the method in five steps.
A size curve is the share of a buy that each size gets. If size M made up 45% of demand last season, M receives about 45% of this season's units, adjusted for anything you know has changed.
You need three numbers per size, for one product group (for example tops): units sold, units returned and weeks in stock. Use one group at a time. Sizes in a hoodie and sizes in a trouser do not behave alike.
Net units = units sold minus returns. Sizes that run small or large often return more, and gross sales hide that.
A size that sold out early understates demand. Put every size on the same footing:
Full-season rate = net units ÷ weeks in stock × weeks in season
Share = size rate ÷ sum of all rates. The list of shares is your curve.
Multiply the planned units for a style by each share, then round to your pack multiple. Check that the total still matches, and nudge the biggest size to close any gap.
Under roughly 30 net units per curve, treat the result as a rough guide. Use a comparable product or your judgement, and revisit after the first selling weeks.
These figures are made up to show the arithmetic. They are not market data. Season of 12 weeks, tops group:
| Size | Net units | Weeks in stock | Full-season rate | Share |
|---|---|---|---|---|
| XS | 10 | 12 | 10 | 5% |
| S | 42 | 12 | 42 | 21% |
| M | 60 | 8 | 90 | 45% |
| L | 44 | 12 | 44 | 22% |
| XL | 14 | 12 | 14 | 7% |
Why the correction matters: M sold 60 net units in 8 weeks, so its full-season rate is 90. Without the correction M would show a 35% share. With it, M is at 45%.
Buy plan for 300 units, pack multiple 3 (same invented example):
| Size | Units |
|---|---|
| XS | 15 |
| S | 63 |
| M | 135 |
| L | 66 |
| XL | 21 |
| Total | 300 |
The free Size-Curve Starter for Excel and Google Sheets does these steps for you: it nets out returns, corrects for sell-outs, shows a low-history warning and splits up to five styles into units per size. The free version covers one curve and up to six sizes. It is a planning aid and does not forecast demand.
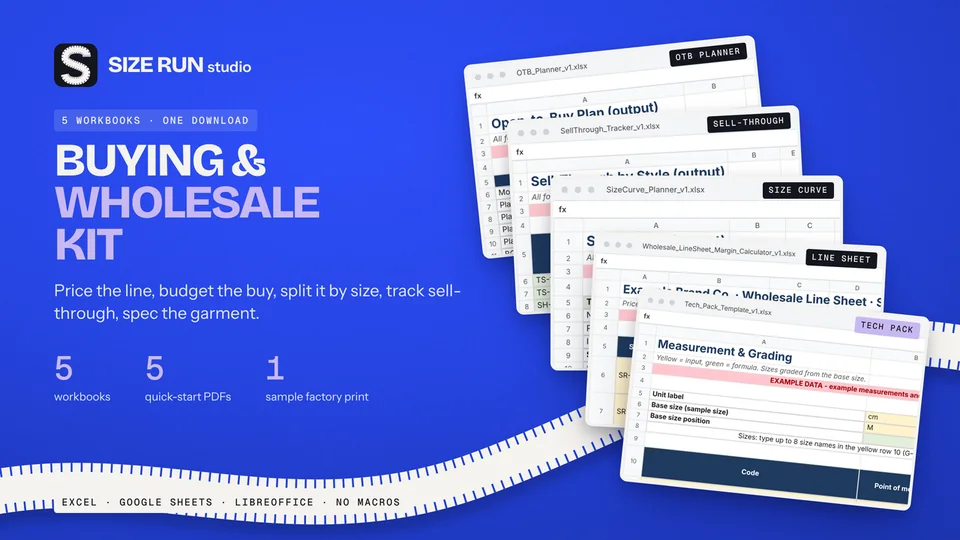
Get the free Size-Curve Starter Full Buying & Wholesale Kit on Etsy Line Sheet template on Etsy Free. Gumroad asks for an email address only to deliver the file.
With your sales by size at hand, the five steps take roughly 15 minutes for one product group.
Units sold, units returned and weeks in stock for each size of one product group.
Under roughly 30 net units per curve, treat the result as a rough guide and use a comparable product or your judgement.
No. They are invented to show the arithmetic and are not market data.
Built for Google Sheets: upload the .xlsx to Google Drive and open it with Sheets; formulas are standard.
Turn last season's units by size into a buy plan. Free.
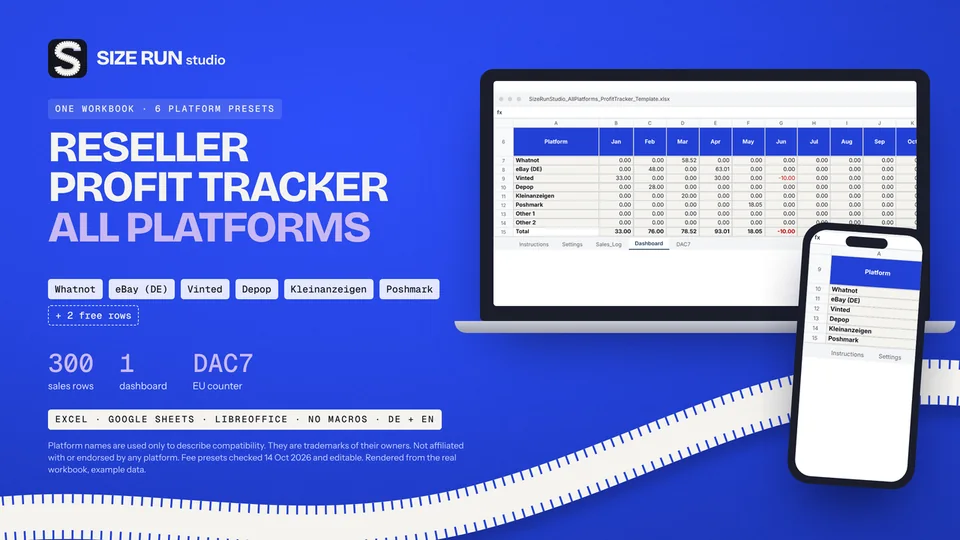
Fees, net profit, margin and ROI per platform and month.
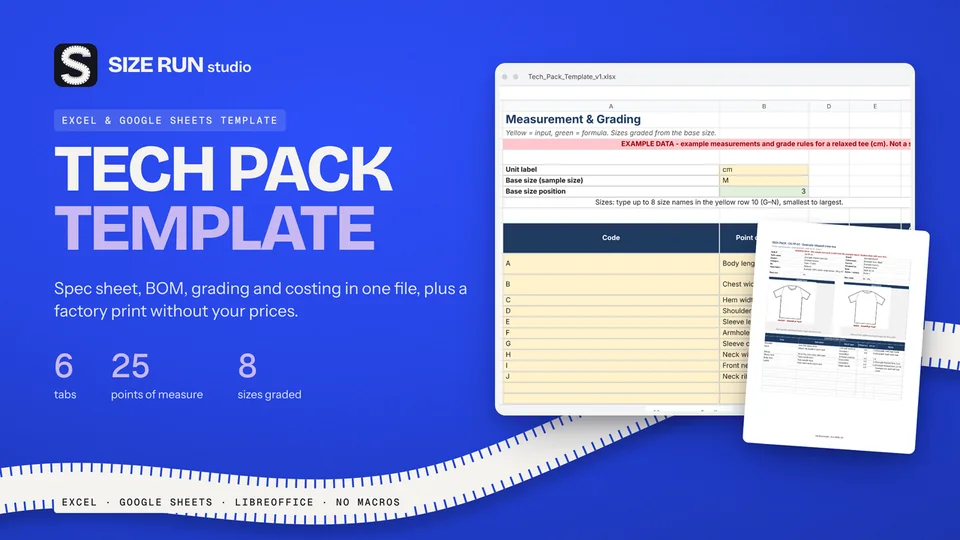
Spec sheet, BOM, grading and costing in one file.
What you keep per resale after fees and shipping.
The open-to-buy formula with a worked example, at retail and at cost.
Sell-through rate and weeks of cover, with a worked example.
Why a 50% markup is not a 50% margin, with a worked example.
What a production tracker needs, how to flag late samples and orders, with a worked example.
Which columns a wholesale price list needs and how to price from landed cost, with a worked example.
Fee, net profit, margin and ROI per sale, with a worked example and editable fee rates.
Line sheet, tech pack and production tracker: what each covers, plus a worked margin example.
How to track bookings, host fee, payout, occupancy and profit per property, with a worked example.
Track Etsy fees, net profit and margin per sale, with a worked example and editable fee rates.
How to track invoices, overdue payments, income and profit per hour, with a worked example.
How to budget when every month pays differently: baseline, buffer and set-aside, with a worked example.
How to track wedding vendor deposits, balances and due dates in one spreadsheet, with a worked example.
Invoice tracker and irregular-income budget planner in one bundle, with worked examples.