 Size Run
Free size curve template for apparel buyers
Turn last season's units by size into a buy plan. Free.
Sell through rate explained: the formula, a worked example with weeks of cover, and how to read a low or high result when you plan a fashion buy.
Sell through rate tells you how much of the stock you had has actually left the building. It is one of the quickest ways to see which styles earn their space and which ones need a decision. This page covers the formula, a worked example and what to do with the result.
Sell through rate is the percentage of available stock that has sold in a given period. A high rate means most of what you had is gone. A low rate means stock is sitting. On its own it does not say whether that is good, because that depends on how long the product has been on sale.
Sell through rate (%) = units sold / units available x 100
Units available means the stock you started the period with plus anything received during it. Use the same period for both numbers, for example a single week, a month or the season to date.
A companion figure helps you read it:
Weeks of cover = units still in stock / average units sold per week
Weeks of cover turns stock into time. It answers how long the current stock lasts at the current pace.
These figures are made up to show the arithmetic. They are not market data. Two styles, six weeks into the season:
| Style A | Style B | |
|---|---|---|
| Opening stock | 140 | 100 |
| Received | 60 | 50 |
| Units available | 200 | 150 |
| Units sold | 120 | 45 |
| Units left | 80 | 105 |
Style A: sell through = 120 / 200 = 60%. Average sales are 120 / 6 = 20 units per week, so weeks of cover = 80 / 20 = 4 weeks.
Style B: sell through = 45 / 150 = 30%. Average sales are 45 / 6 = 7.5 units per week, so weeks of cover = 105 / 7.5 = 14 weeks.
Same season, same week, very different pictures. Style A may run out before the season ends and is a candidate for a reorder if the supplier can deliver in time. Style B has far more stock than the pace supports and needs a plan, such as repositioning, bundling or a planned price action.
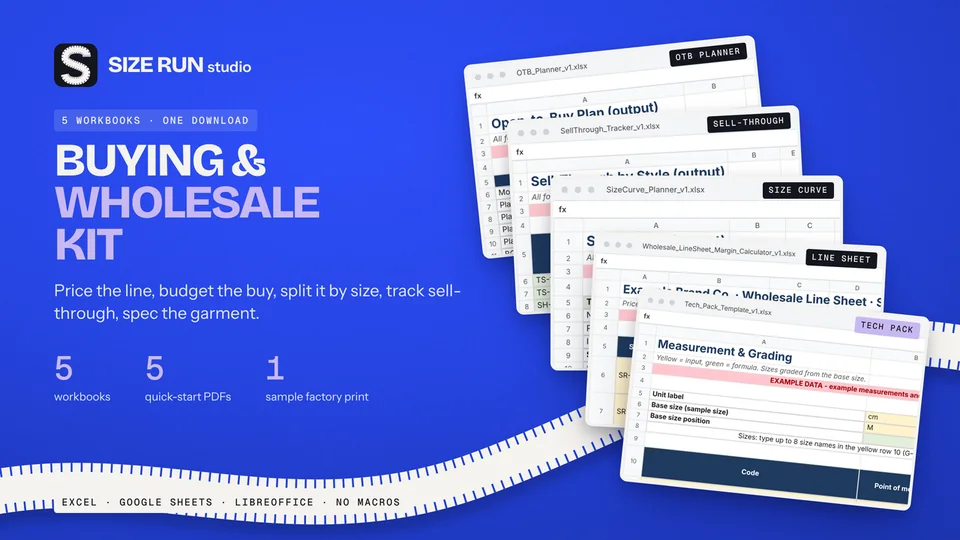
The Sell-Through Tracker in the Buying & Wholesale Kit calculates sell through %, weeks of cover, a season-end projection and an action flag for up to 50 styles. It comes with labelled example data that you replace with your own figures. It is a planning aid and does not decide for you.
The Kit is a paid product and also includes an Open-to-Buy Planner, a Size-Curve Planner, a Wholesale Line Sheet with margin calculator and a Tech Pack template. The formulas above work in any spreadsheet for free, and the tracker saves you the setup.
See the Buying & Wholesale Kit
Sell through rate is the share of the stock you had available that has been sold in a period. It is units sold divided by units available, shown as a percentage.
There is no single answer. It depends on the category, the season length and how far into the season you are. Compare styles with each other and with your own past seasons.
Either works if you stay consistent. Units are simpler and avoid distortion from price changes, so most buyers start there.
No. They are invented to show the arithmetic and are not market data.
Turn last season's units by size into a buy plan. Free.
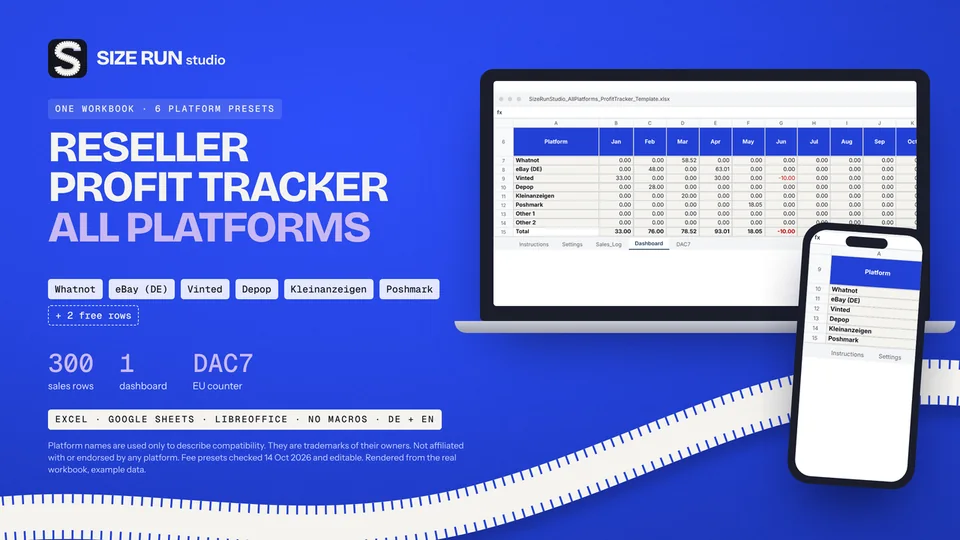
Fees, net profit, margin and ROI per platform and month.
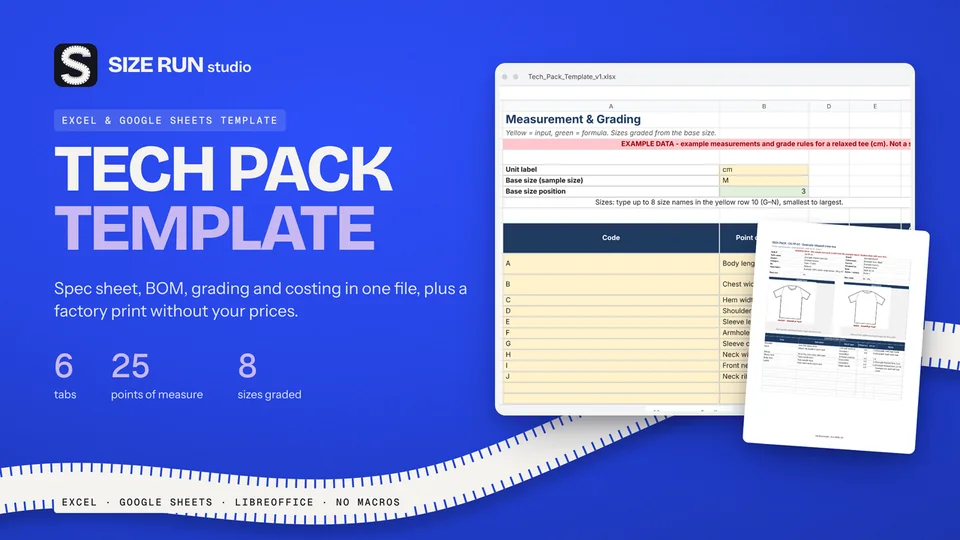
Spec sheet, BOM, grading and costing in one file.
A worked example, step by step, from net units to units per size.
What you keep per resale after fees and shipping.
The open-to-buy formula with a worked example, at retail and at cost.
Why a 50% markup is not a 50% margin, with a worked example.
What a production tracker needs, how to flag late samples and orders, with a worked example.
Which columns a wholesale price list needs and how to price from landed cost, with a worked example.
Fee, net profit, margin and ROI per sale, with a worked example and editable fee rates.
Line sheet, tech pack and production tracker: what each covers, plus a worked margin example.
How to track bookings, host fee, payout, occupancy and profit per property, with a worked example.
Track Etsy fees, net profit and margin per sale, with a worked example and editable fee rates.
How to track invoices, overdue payments, income and profit per hour, with a worked example.
How to budget when every month pays differently: baseline, buffer and set-aside, with a worked example.
How to track wedding vendor deposits, balances and due dates in one spreadsheet, with a worked example.
Invoice tracker and irregular-income budget planner in one bundle, with worked examples.